Baltimore Orioles Offensive Woes Run Deep in 2018
By Nate Wardle

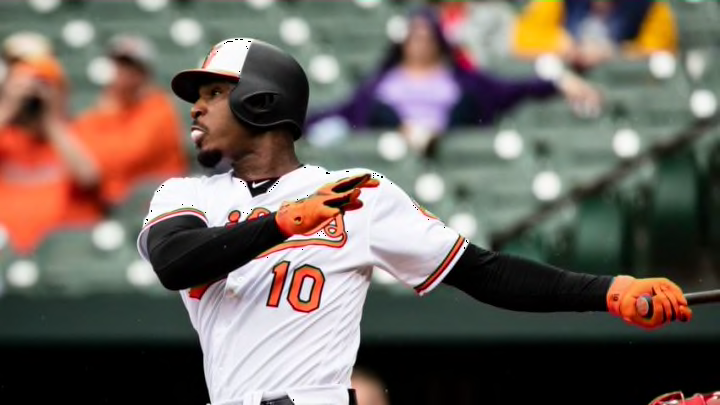
ST PETERSBURG, FL – MAY 27: Jonathan Schoop #6 of the Baltimore Orioles reacts after striking out in the fourth inning on May 27, 2018 at Tropicana Field in St Petersburg, Florida. The Rays won 8-3. (Photo by Julio Aguilar/Getty Images)
Then, there are the areas that make you shudder. The areas where the Orioles were in the top 10 in 2017 (well, except the obvious), and in 2018, are close to dead last, or are dead last.
First, the position you may not have thought of at first.
In 2017, the Orioles’ catchers hit .275/.313/.478 with 31 home runs, 162 hits, 78 runs and 82 RBIs. Those numbers ranked fifth, 15th, third, second, fourth, sixth, and 11th. The only outliers were on-base percentage, of course, and RBIs.
This year? .202/.272/.330 with four home runs, 44 hits, 19 runs and 19 RBIs. Those numbers rank 23rd, 24th, 24th, 24th, 26th, 27th and 25th.
Sure, Welington Castillo is gone. But Caleb Joseph was part of that 2017 success, and he is in the minors. Andrew Susac, Chance Sisco, Joseph and Austin Wynns have not been anywhere near as good.
Looking at first base here is going to be relatively useless, since we know Chris Davis is having a horrible season.
Just for reference, last year the Orioles’ first baseman hit .246/.322/.467. Each of those numbers was either in the bottom ten in the league, or around it. This year, the Orioles are last and it isn’t close.
Now, let’s look at the position where the drop off has been probably the most startling, second base.
Last season, the Orioles’ second basemen, led by Jonathan Schoop, hit .285/.332/.487 with 31 home runs, 180 hits, 92 runs and 103 RBIs. That had the team ranked eighth, 14th, fourth, second, eighth, 13th, and second. The only ones out of the top 10 were on-base percentage and runs scored, and that is partly due to Schoop’s position in the order.
This season, it has not been as good.
The Baltimore Orioles’ second basemen are hitting .189/.244/.301 with six home runs, 49 hits, 20 runs and 20 RBIs. Those numbers are 30th (last), last, 26th, 16th, tied for last, tied for last, and tied for 28th. The only number close to average here is in home runs. Considering the Orioles were second last year in home runs, that is a major issue as well.
I think we all knew the Orioles’ offense has been atrocious in 2018, but this comparison shows just how bad it has been.