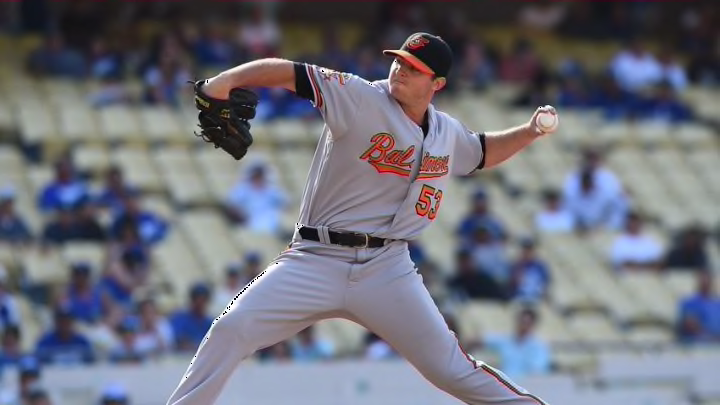
Baltimore Orioles: Comparing Zach Britton to the Best Closers

How does the current outstanding season being put up by Baltimore Orioles closer Zach Britton compare to the best relievers in recent years?
There is no doubt that Britton is dazzling in the role he plays, now adding up numbers that are rather rare and unique. At this point after 38 games and going 27-for-27 in save opportunities, Britton has an amazing ERA of 0.72 in 37.2 innings. His WHIP stands at 0.823. All of this explains why he was the last guy on the mound at the end of the All-Star Game.
Over the past three years, Britton is 9-4 with a 1.55 ERA and WHIP of 0.918 … all of this over a total of 180 innings. Add to this 184 strikeouts. Simply fantastic numbers!
But how do these statistics compare with the very best relievers in the past couple of years? Or, beyond that, how does it compare to the ultimate closer – Mariano Rivera?
To make this comparison work, let us start with projecting Britton’s numbers over the Orioles’ first 87 games into a full 162-game season. This will bring him to a total of 70 innings pitched with 50 saves. In the chart below, he is on the top line (Brit 16).
The top saves leader in the National League just last year was Mark Melancon (Mel 15) of the Pirates. He totaled 50 saves, which is equal to Britton’s projections. But note the higher ERA of 2.23 and fewer strikeouts.
Next let us compare to the fantastic seasons of 2013 and 2014 for Greg Holland of the Royals (GH 13, GH 14). The ERA is a bit higher than Britton’s projections, along with the WHIP just slightly more, but the greater number of strikeouts for similar innings is remarkable.
Greg Kimbrell had a number of recent outstanding seasons for the Atlanta Braves, and we’ll look at two of them from 2012 and 2013 (GK 12, GK 13). The strikeouts per innings pitched are even better than the numbers for Holland, and all the other stats are in a similar range as Britton’s projection.
The greatest of them all is Mariano Rivera. The 13-time All-Star pitched in 19 seasons and registered a total of 652 career saves. Standing out among his statistics is the incredible consistency for year after year. For comparison’s sake, I selected the year he had his highest number of saves (MR 04) and the season where he had his lowest total earned run average (MR 08). His strikeout numbers are not really higher than Britton’s, though the ERA is higher than what Zach would have if he can maintain the 0.72 number over the whole season.
Putting all of this on a graph …
| Name/Yr | ERA | IP | SV | WHIP | SO |
| Brit 16 | 0.72 | 70 | 50 | 0.823 | 80 |
| Mel 15 | 2.23 | 78 | 51 | 0.982 | 62 |
| GH 13 | 1.21 | 67 | 47 | 0.866 | 103 |
| GH 14 | 1.44 | 62.1 | 46 | 0.914 | 90 |
| CK 12 | 1.01 | 62.2 | 42 | 0.654 | 116 |
| CK 13 | 1.21 | 67 | 50 | 0.881 | 98 |
| MR 04 | 1.94 | 78.2 | 53 | 1.081 | 66 |
| MR 08 | 1.40 | 70.2 | 39 | 0.665 | 77 |
Conclusion: Zach Britton is having a rare season of excellence, especially considering the very low ERA. It can be seen from the relatively modest strikeout numbers (relative to some of the other top relievers) that he induces more poor contact than that he simply blows batters away. And this was true of Rivera as well.
More from Baltimore Orioles
- What other Baltimore Orioles Offseason Storylines will you be interested in seeing?
- Baltimore Orioles to Face Numerous Playoff Contenders Down the Stretch
- Baltimore Orioles Showing Encouraging Signs During Recent Wins
- The Baltimore Orioles and the Expanded September Roster
- Orioles Josh Rogers Expectations in his Major League Debut
But by any measure, Zach is in rare air category. While not maybe in a class by himself, he is in a category where it does not take long to call roll! If Britton can indeed register 50 saves this year, this will put him into second place all-time of the O’s list with 123, one ahead of Jim Johnson at 122. This would trail Gregg Olson, who has the most at 160 (though never more than 36 in a single season).